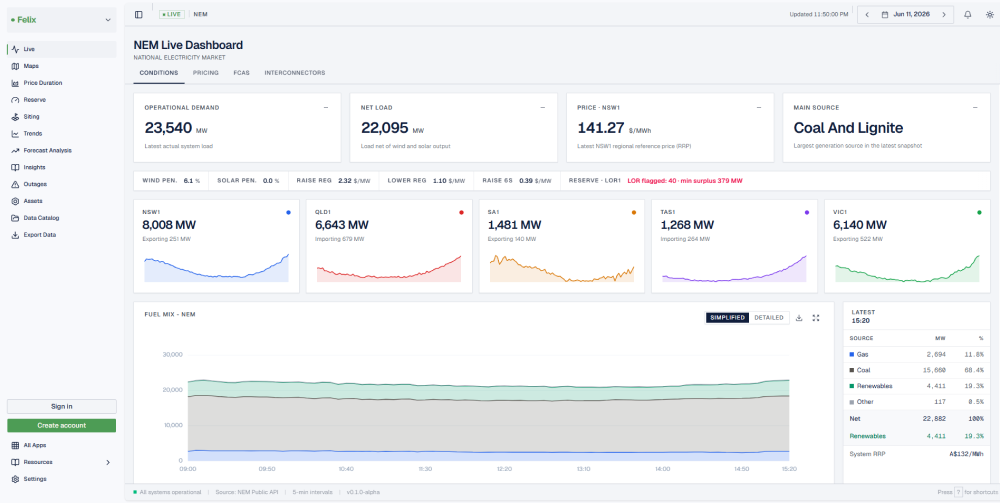
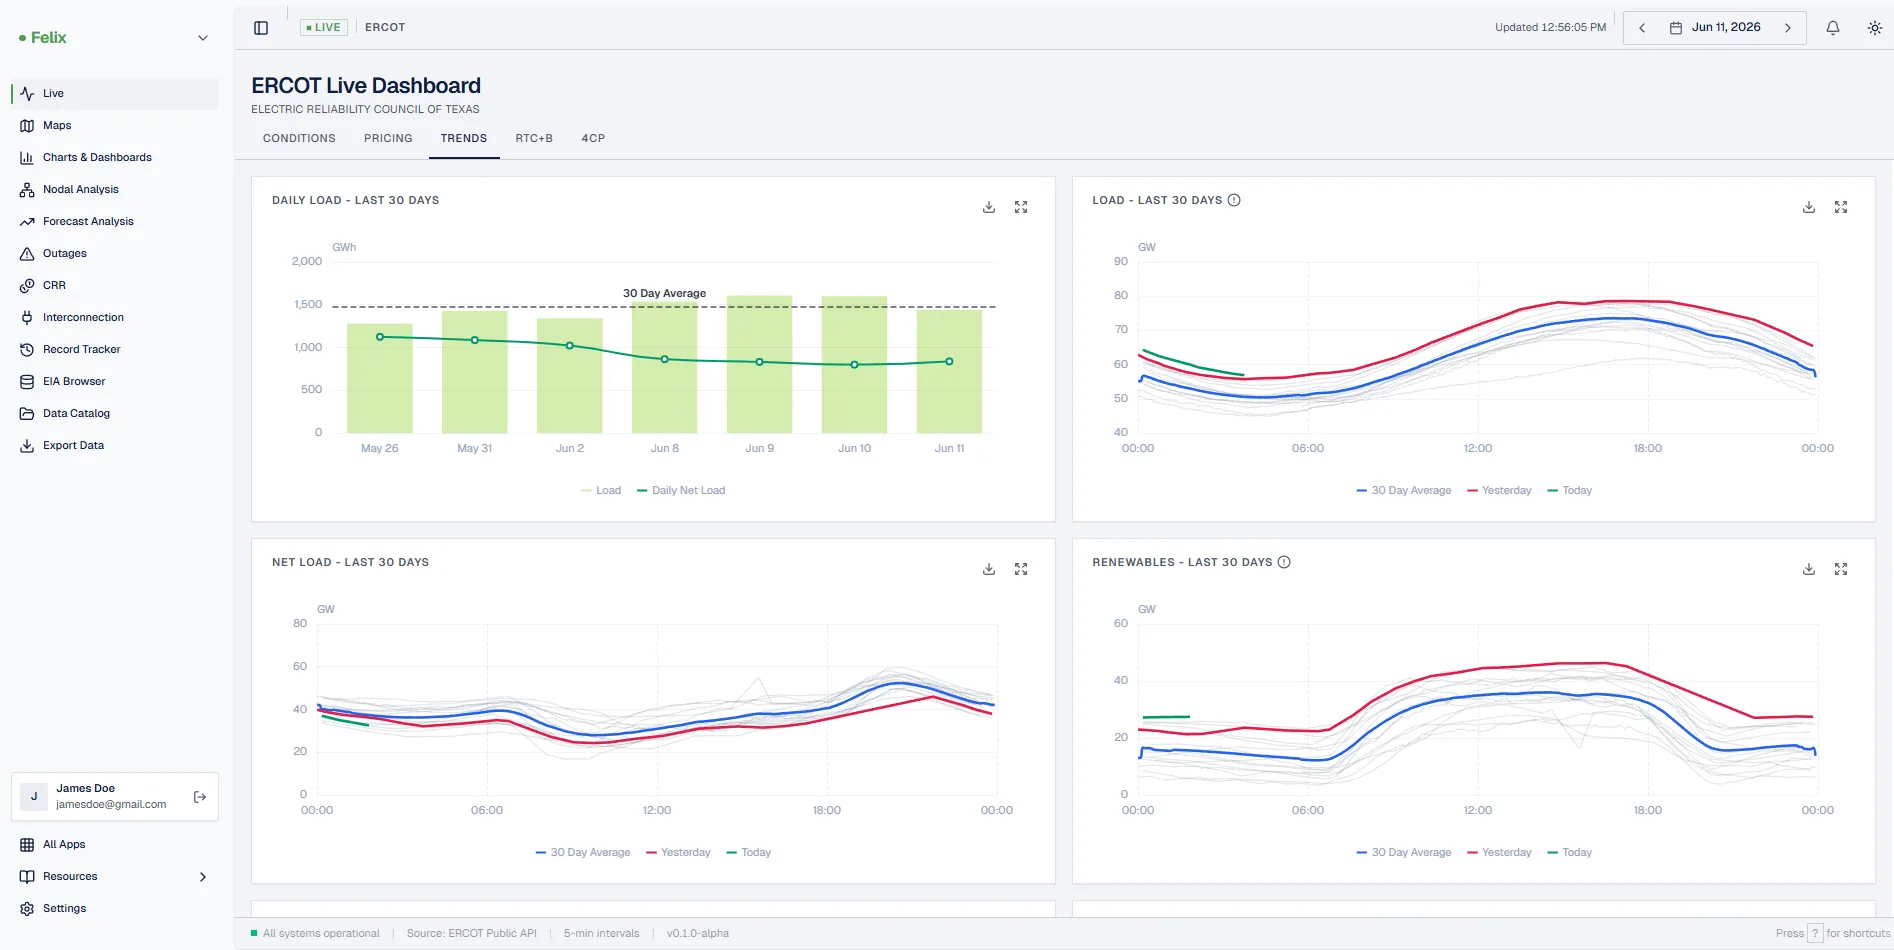
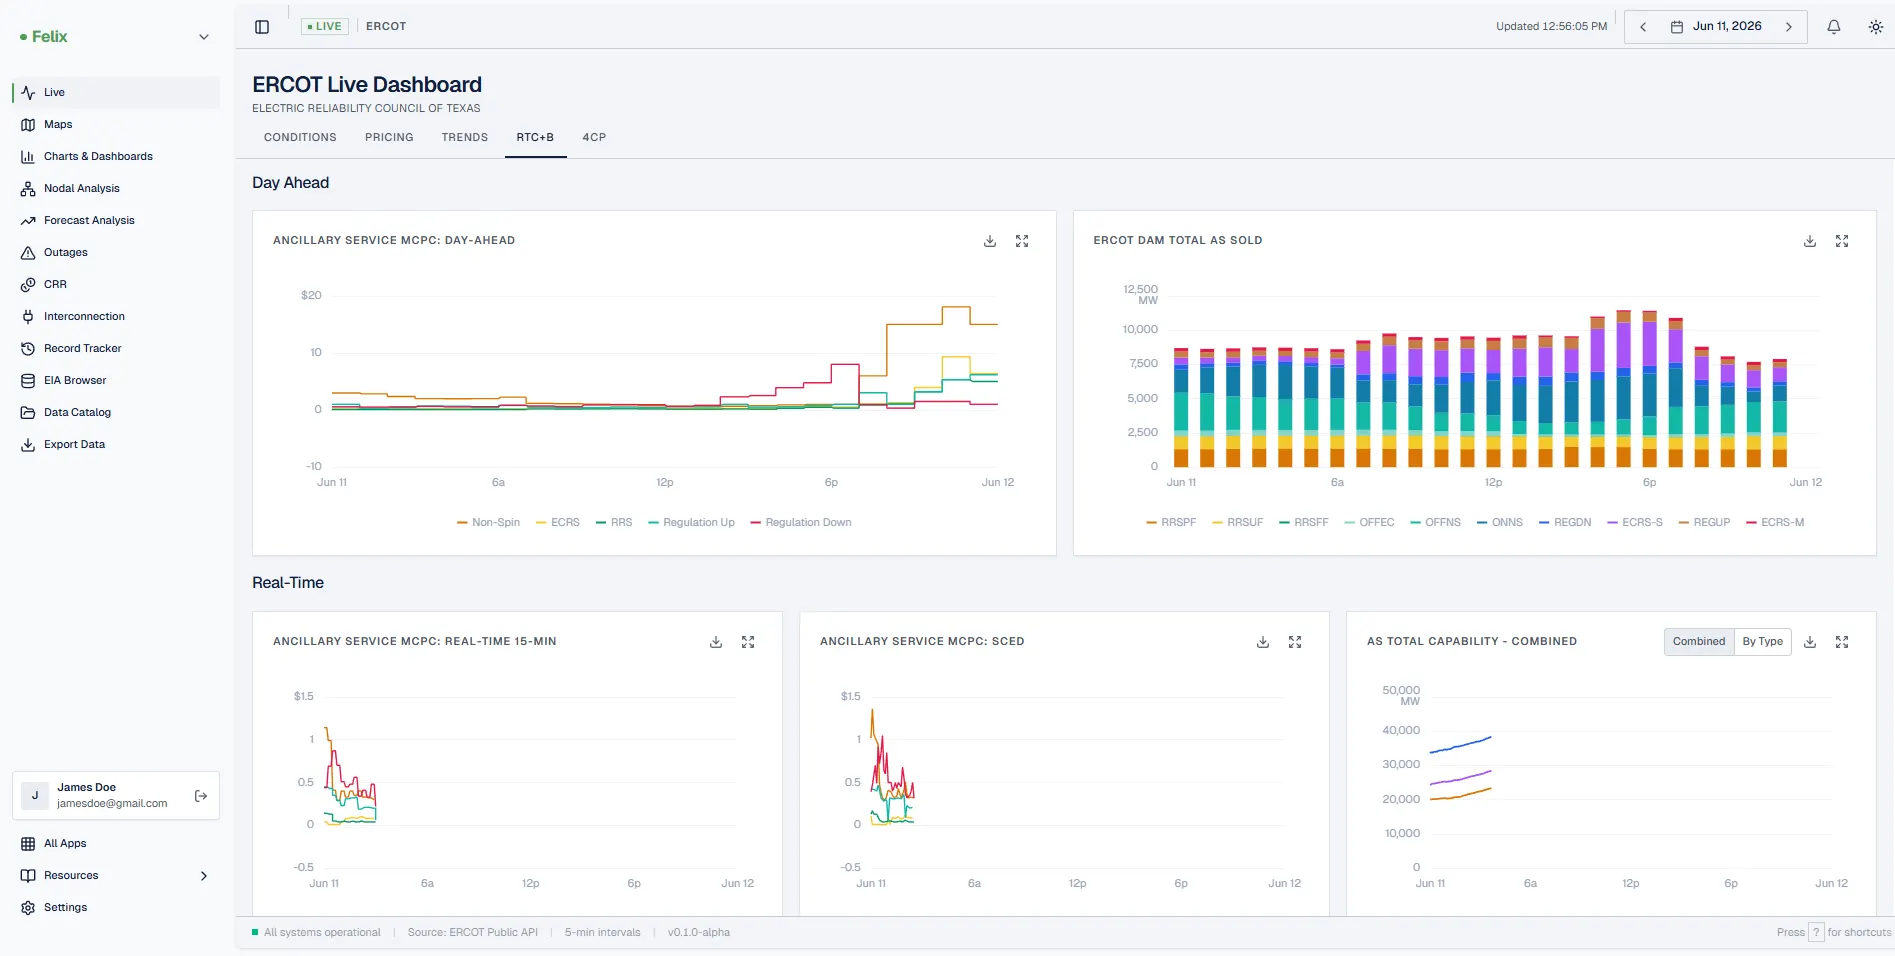
What does Market Pulse actually show me?
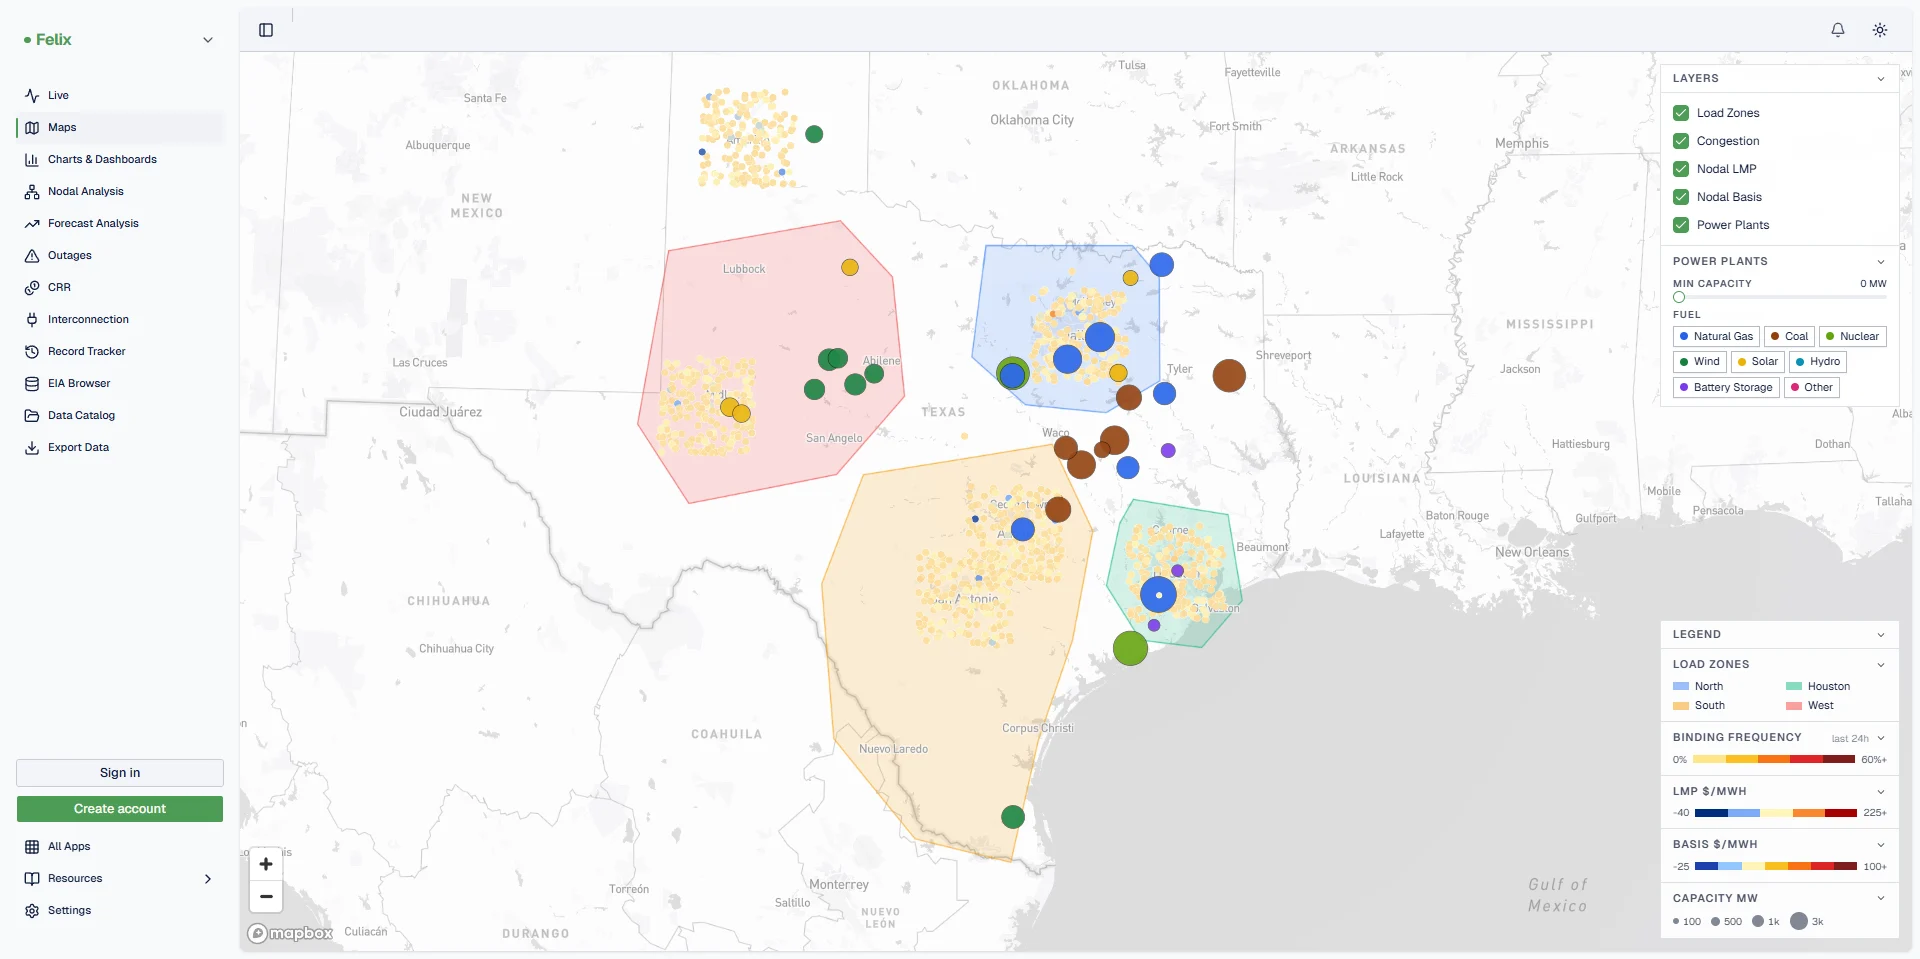
Substation capacity and real headroom, upgrade-cost exposure, and interconnection-queue activity across every market we cover, all in one continuously updated view.
Where does the data come from?
From the latest power flow models for each ISO and utility, run through the same software the ISOs and utilities rely on, including PowerGEM's TARA and Siemens PTI's PSS®E. It is built and maintained by former ISO and utility planners.
How often is it updated?
The data is refreshed with every model release, so your team is always working from a current picture rather than a snapshot that has already aged.
How is this different from a public ISO capacity map?
Public maps show a headline number and rarely include real upgrade costs or non-public queue activity. Market Pulse shows study-grade capacity, the upgrades a project would trigger, and how the queue is moving around a site.