GridHorizon

Where Future Grid Conditions Meet Today’s Siting Decisions

GridHorizon screens every point of interconnection across a region for real capacity and upgrade-cost exposure, so you can find build-ready sites in minutes instead of months. This is the product you have known as Headroom Capacity.

1 s
of POIs screened on demand
1 + GW
of projects modeled
$ 1 B+
in cost discrepancies found
> 1 %
accuracy against ISO studies
Finding a site is really a question about the grid: where does real transmission capacity exist, what would it cost to connect, and how will that change as new projects arrive? Generic heatmaps cannot answer it, and manual GIS work and consultant studies take months you do not have. GridHorizon answers it across a whole region at once. It produces study-grade results for every point of interconnection, color-coded by available capacity and upgrade-cost exposure and refreshed with every model release. You can rank a region in minutes, see how capacity shifts as the queue evolves, and bring your own market assumptions into the view, so the sites you shortlist are the ones worth studying in GridSim.

Defensible Siting for High-Stakes Decisions

Find build-ready sites with confidence.

Screen more than a thousand substations across an ISO and spot the points of interconnection with real headroom in minutes, not months.

Expose location risk others miss.

See upgrade-cost exposure alongside capacity, so you can rule out sites that look open but carry a long-lead, deal-breaking upgrade.

Anticipate how the grid changes around a site.

Understand how queue activity, retirements, and planned upgrades will shift capacity over time, so you site for where the grid is heading.

Replace manual GIS and consultant work.

One platform takes the place of spreadsheets, GIS tracing, and slow consultant studies, so your team moves faster with less cost.

market pulse
REGION-WIDE SCREENING

Rank Every POI on a Single Heatmap.

GridHorizon produces on-demand, study-grade results for every point of interconnection in a region, color-coded for available capacity and upgrade-cost exposure, so you can rank a whole market in minutes.

COST EXPOSURE

See What a Site Would Really Cost to Connect.

Capacity is only half the story. GridHorizon shows the upgrade-cost exposure at each point of interconnection, so you can disqualify sites that hide a long-lead upgrade before you spend on diligence.

YOUR MARKET VIEW

Anticipate Queue-Driven Change.

Bring your view of queue drop-offs, retirements, and planned upgrades into the model and apply it to every point of interconnection at once, so the heatmap reflects how you read the market.

Frequently Asked Questions about GridHorizon

Still have questions?

Is this the same as Headroom Capacity?
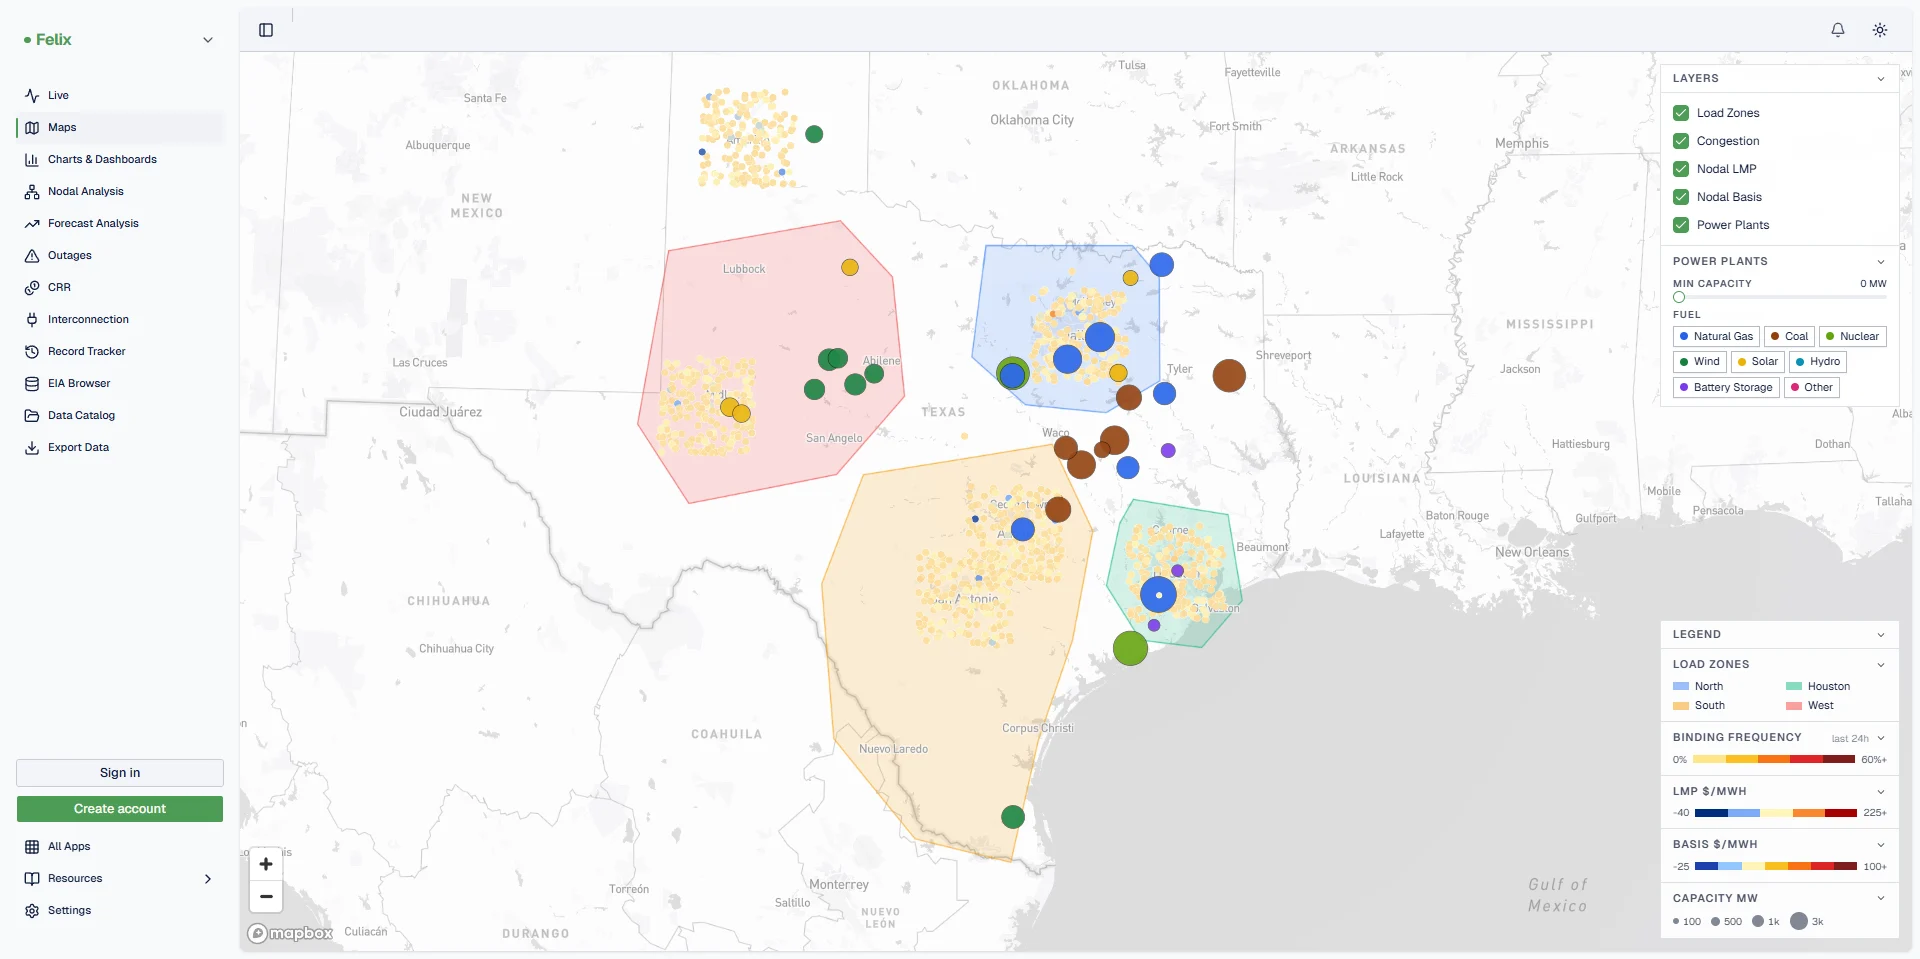
Yes. GridHorizon is the Headroom Capacity product, rewritten and renamed. The region-wide prospecting heatmap, real capacity and upgrade-cost data, and on-demand results are all still here.
Who is GridHorizon for?
Generation and large-load developers, IPPs, and planning teams who need to screen a region quickly and focus on the sites with the fastest, lowest-cost path to power.
How is it different from a public capacity map?
Public maps show a headline number with no real upgrade costs and no view of the queue. GridHorizon shows study-grade capacity, upgrade-cost exposure, and how the picture changes as projects enter the queue.
How does GridHorizon work with GridSim?
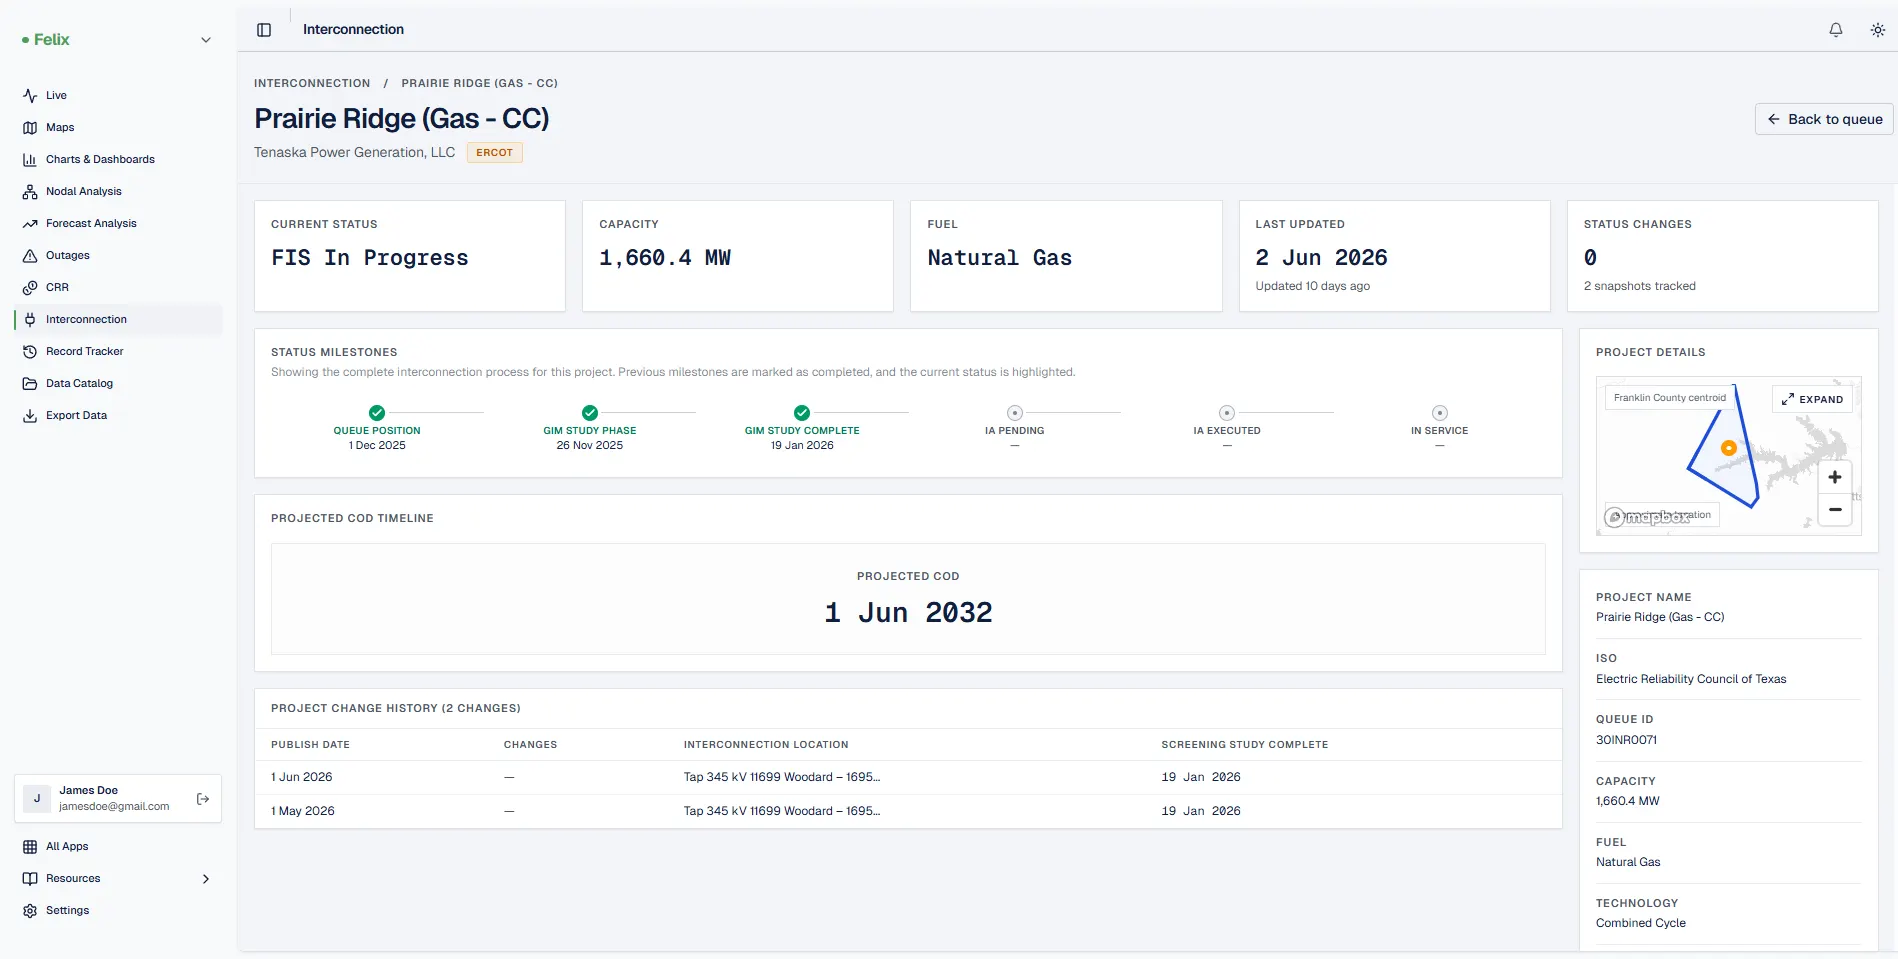
GridHorizon is where you screen a region and build a shortlist. GridSim is where you go deep on those priority sites and re-run the full ISO study under your own assumptions. They are designed to work together.
Which markets are covered?
Every major U.S. market. You subscribe to the regions and ISOs you need, with pricing per region and discounts when you take more than one. Get in touch and we will confirm current coverage.
get start journey with us

Ready to find build-ready sites in minutes?